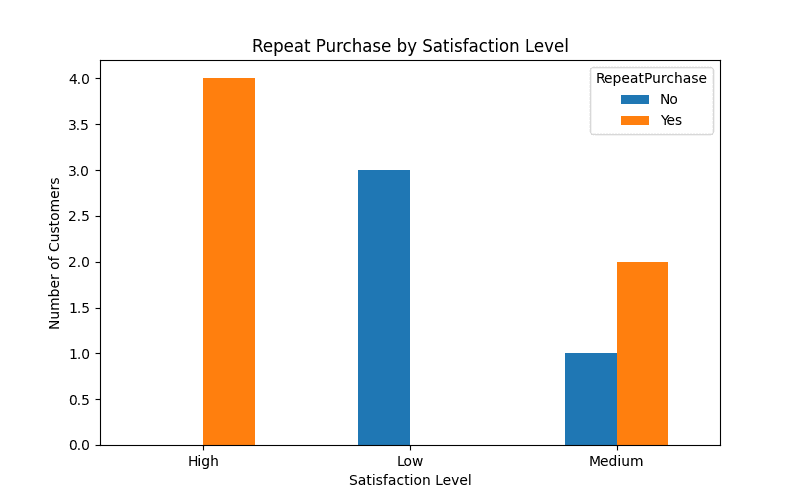
2. You are given a dataset with categorical variables about customer satisfaction levels (Low, Medium, High) and whether customers made repeat purchases (Yes/No). Create visualizations such as bar plots or stacked bar charts to explore the relationship between satisfaction level and repeat purchases. What can you infer from the data?
PROGRAM:
import pandas as pd
import matplotlib.pyplot as plt

# dataset
data = {
    'Satisfaction': ['Low', 'Medium', 'High', 'Medium', 'High', 'Low', 'High', 'Medium', 'Low', 'High'],
    'RepeatPurchase': ['No', 'Yes', 'Yes', 'No', 'Yes', 'No', 'Yes', 'Yes', 'No', 'Yes']
}

# Create DataFrame
df = pd.DataFrame(data)

# Create a crosstab to count occurrences
cross_tab = pd.crosstab(df['Satisfaction'], df['RepeatPurchase'])

print(cross_tab)

# --- Visualization 1: Grouped Bar Plot ---
cross_tab.plot(kind='bar', figsize=(8,5))
plt.title('Repeat Purchase by Satisfaction Level')
plt.xlabel('Satisfaction Level')
plt.ylabel('Number of Customers')
plt.xticks(rotation=0)
plt.show()

# --- Visualization 2: Stacked Bar Chart ---
cross_tab.plot(kind='bar', stacked=True, figsize=(8,5), color=['red','green'])
plt.title('Repeat Purchase by Satisfaction Level (Stacked)')
plt.xlabel('Satisfaction Level')
plt.ylabel('Number of Customers')
plt.xticks(rotation=0)
plt.show()OUTPUT:
RepeatPurchase  No  Yes
Satisfaction
High             0    4
Low              3    0
Medium           1    2

