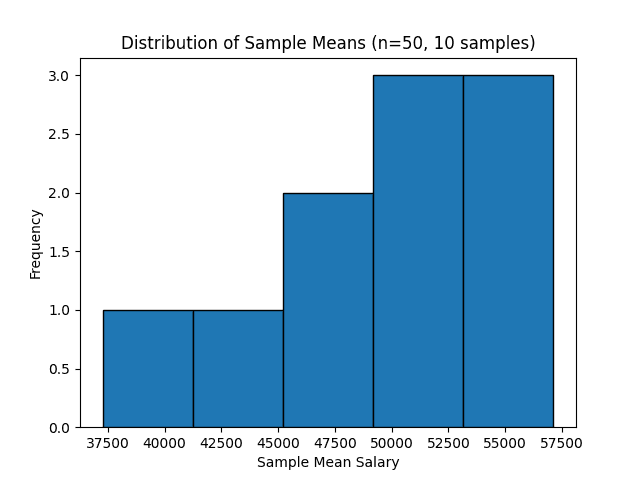
4. You want to estimate the mean salary of software engineers in a country. You take 10 different random samples, each containing 50 engineers, and calculate the sample mean for each. Plot the distribution of these sample means. How does the Central Limit Theorem explain the shape of this sampling distribution, even if the underlying salary distribution is skewed?
PROGRAM:
import numpy as np
import matplotlib.pyplot as plt

# Simulate population salaries (skewed distribution)
np.random.seed(42)
population_salaries = np.random.exponential(scale=50000, size=10000)  # skewed data

# Number of samples and sample size
num_samples = 10
sample_size = 50

# Calculate sample means
sample_means = []
for _ in range(num_samples):
    sample = np.random.choice(population_salaries, size=sample_size, replace=False)
    sample_means.append(np.mean(sample))

# Plot the distribution of sample means
plt.hist(sample_means, bins=5, edgecolor='black')
plt.title("Distribution of Sample Means (n=50, 10 samples)")
plt.xlabel("Sample Mean Salary")
plt.ylabel("Frequency")
plt.show()

# Print sample means
print("Sample Means:", sample_means)OUTPUT:
Sample Means: [50407.49240985955, 47441.48917339016, 46359.98208875922, 51123.35940175571, 54792.45402080486, 42987.13036469506, 53695.91997831957, 57123.356348168345, 51519.533296452275, 37272.40519664386]