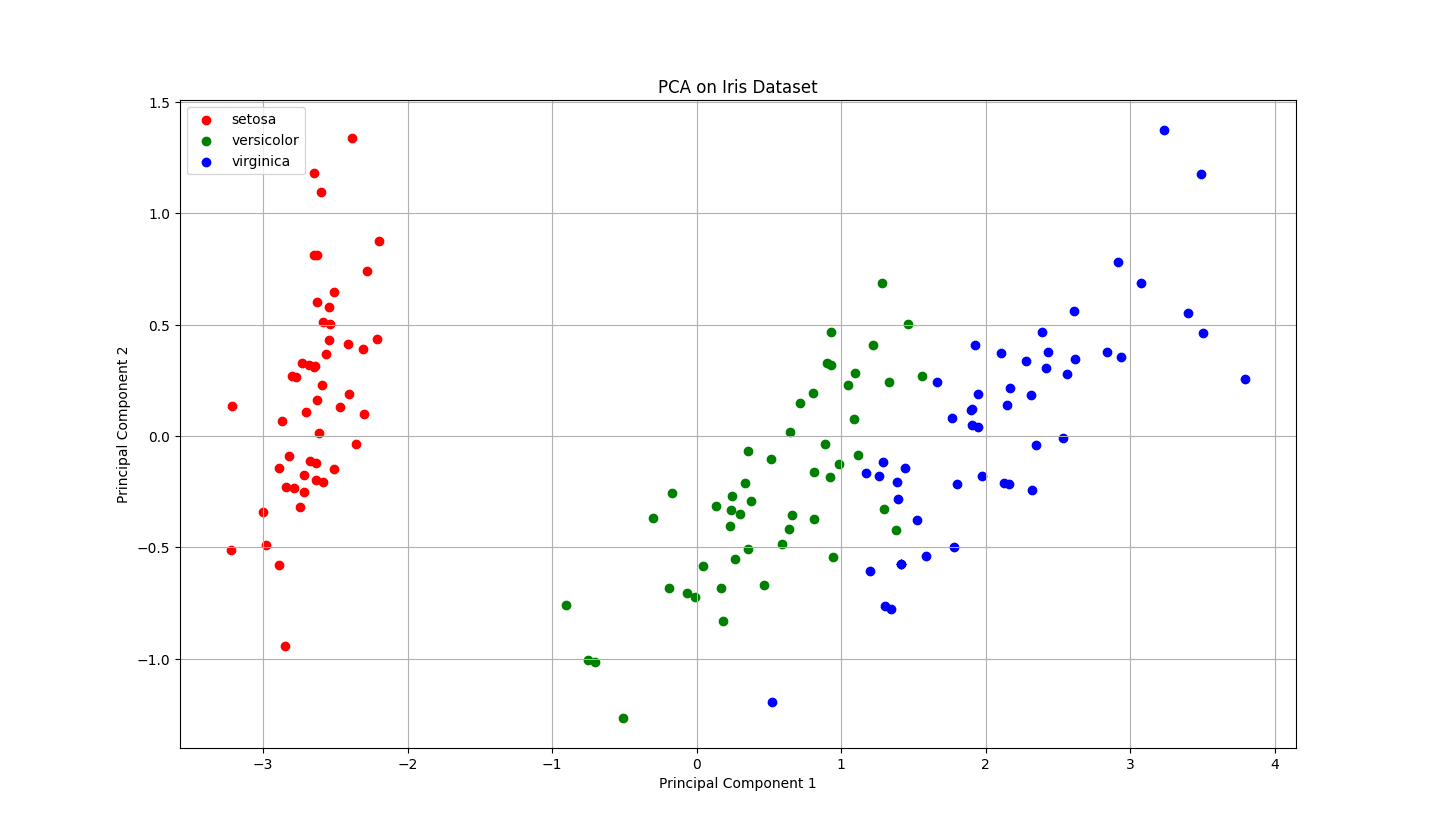
3. Develop a program to implement Principal Component Analysis (PCA) for reducing the dimensionality of the Iris dataset from 4 features to 2.
PROGRAM:
import numpy as np
import pandas as pd
from sklearn.datasets import load_iris
from sklearn.decomposition import PCA
import matplotlib.pyplot as plt

# Load the Iris dataset
iris = load_iris()
data = iris.data
labels = iris.target
label_names = iris.target_names

# Convert to a DataFrame for better visualization
iris_df = pd.DataFrame(data, columns=iris.feature_names)

# Perform PCA to reduce dimensionality to 2
pca = PCA(n_components=2)
data_reduced = pca.fit_transform(data)

# Create a DataFrame for the reduced data
reduced_df = pd.DataFrame(data_reduced, columns=['Principal Component 1', 'Principal Component 2'])
reduced_df['Label'] = labels

# Plot the reduced data
plt.figure(figsize=(8, 6))
colors = ['r', 'g', 'b']
for i, label in enumerate(np.unique(labels)):
    plt.scatter(
        reduced_df[reduced_df['Label'] == label]['Principal Component 1'],
        reduced_df[reduced_df['Label'] == label]['Principal Component 2'],
        label=label_names[label],
        color=colors[i]
    )

plt.title('PCA on Iris Dataset')
plt.xlabel('Principal Component 1')
plt.ylabel('Principal Component 2')
plt.legend()
plt.grid()
plt.show()
OUTPUT:


Thanks bro 🫂