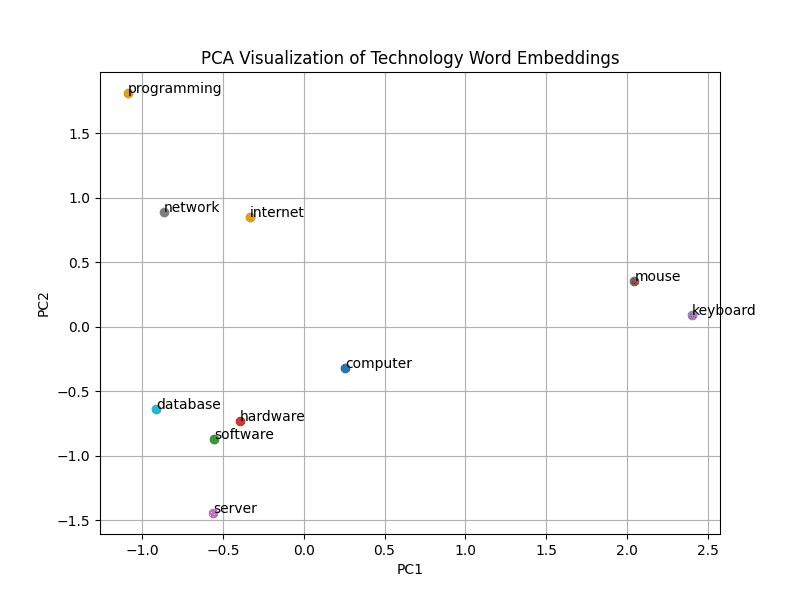
2. Use dimensionality reduction (e.g., PCA or t-SNE) to visualize word embeddings for Q 1. Select 10 words from a specific domain (e.g., sports, technology) and visualize their embeddings. Analyze clusters and relationships. Generate contextually rich outputs using embeddings. Write a program to generate 5 semantically similar words for a given input.
PROGRAM:
# Module or library install command (run this in terminal before running the script)
# pip install gensim matplotlib scikit-learn

import gensim.downloader as api
from sklearn.decomposition import PCA
import matplotlib.pyplot as plt

# Load model
model = api.load("word2vec-google-news-300")

# Select 10 domain-specific words (technology domain)
words = ['computer', 'internet', 'software', 'hardware', 'keyboard', 'mouse', 'server', 'network', 'programming', 'database']
vectors = [model[word] for word in words]

# Dimensionality reduction using PCA
pca = PCA(n_components=2)
reduced = pca.fit_transform(vectors)

# Generate 5 semantically similar words for a given input
input_word = 'computer'
similar_words = model.most_similar(input_word, topn=5)

# Print the similar words to terminal
print(f"Top 5 words similar to '{input_word}':")
for word, score in similar_words:
    print(f"{word}: {score:.4f}")

# Plot the word embeddings
plt.figure(figsize=(8, 6))
for i, word in enumerate(words):
    plt.scatter(reduced[i, 0], reduced[i, 1])
    plt.annotate(word, (reduced[i, 0], reduced[i, 1]))
plt.title("PCA Visualization of Technology Word Embeddings")
plt.xlabel("PC1")
plt.ylabel("PC2")
plt.grid(True)

# Show the plot
plt.show()
OUTPUT:
Top 5 words similar to 'computer':
computers: 0.7979
laptop: 0.6640
laptop_computer: 0.6549
Computer: 0.6473
com_puter: 0.6082

its coming error in google colab which complier is best to run this
pycharm or vscode
Can we use this in jupyter notebook?
no, run only vscode and pycharm