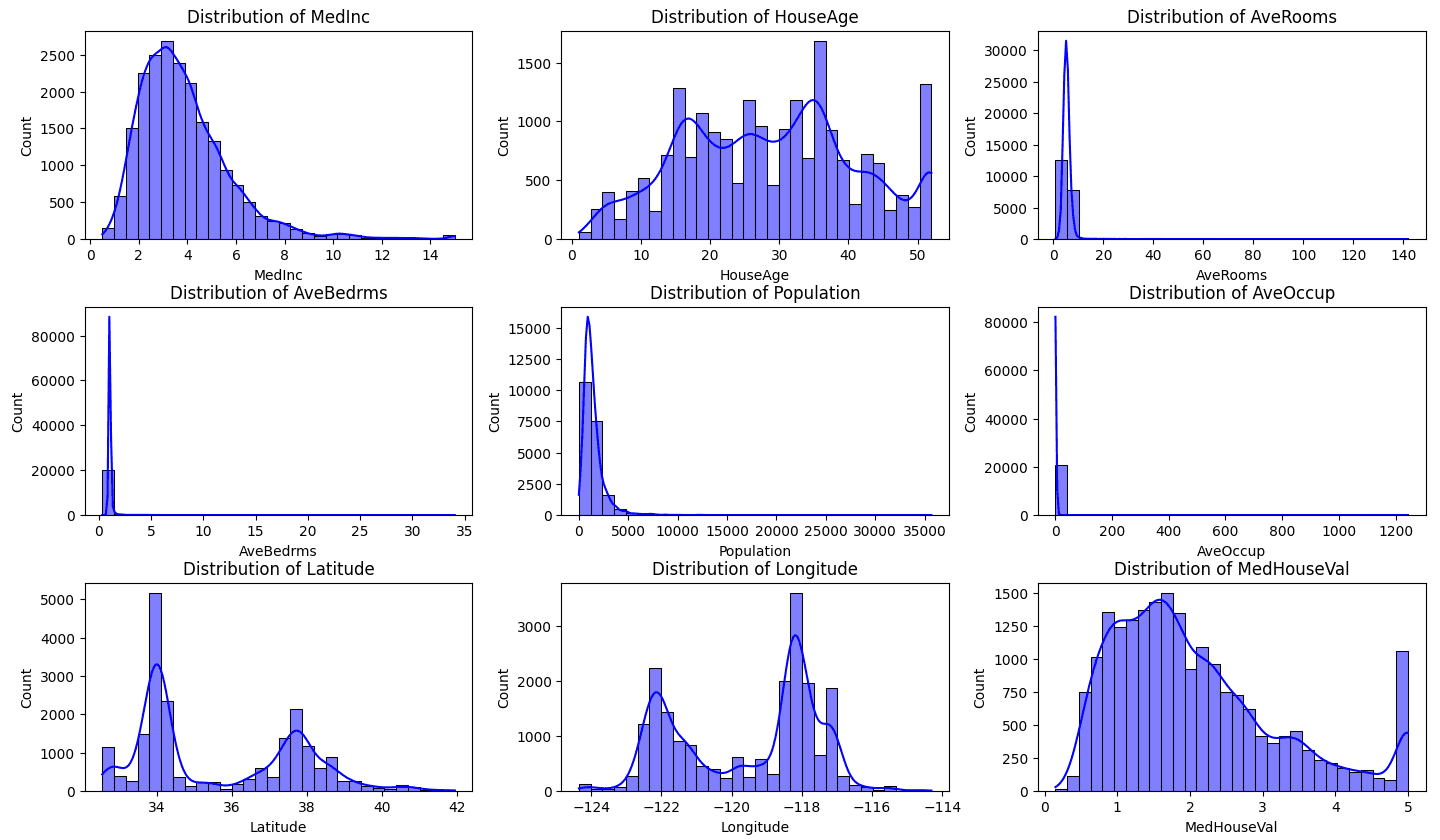
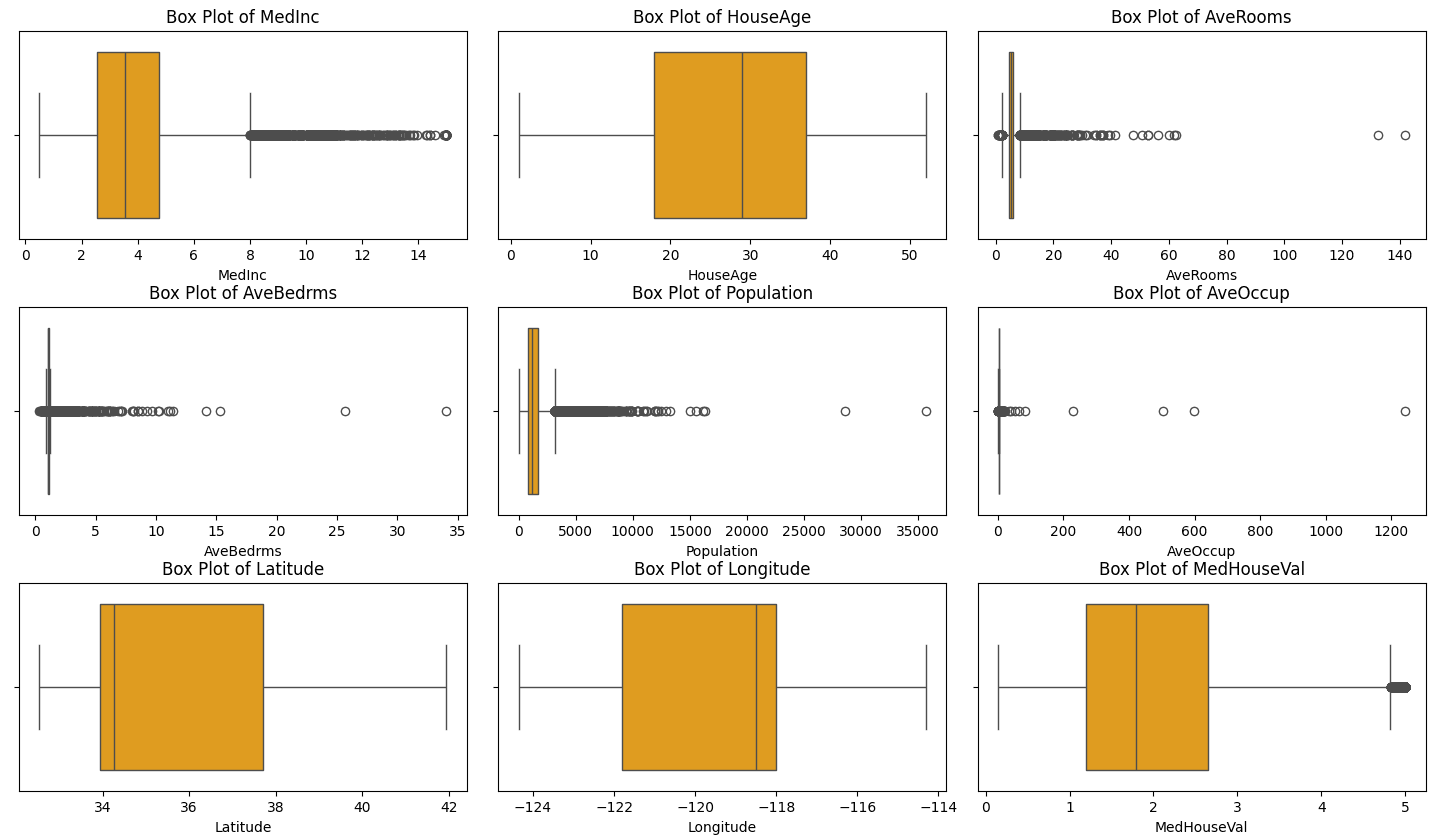
1. Develop a program to create histograms for all numerical features and analyze the distribution of each feature. Generate box plots for all numerical features and identify any outliers. Use California Housing dataset.
PROGRAM:
import pandas as pd
import numpy as np
import seaborn as sns
import matplotlib.pyplot as plt
from sklearn.datasets import fetch_california_housing

# Step 1: Load the California Housing dataset
data = fetch_california_housing(as_frame=True)
housing_df = data.frame

# Step 2: Create histograms for numerical features
numerical_features = housing_df.select_dtypes(include=[np.number]).columns

# Plot histograms
plt.figure(figsize=(15, 10))
for i, feature in enumerate(numerical_features):
    plt.subplot(3, 3, i + 1)
    sns.histplot(housing_df[feature], kde=True, bins=30, color='blue')
    plt.title(f'Distribution of {feature}')
plt.tight_layout()
plt.show()

# Step 3: Generate box plots for numerical features
plt.figure(figsize=(15, 10))
for i, feature in enumerate(numerical_features):
    plt.subplot(3, 3, i + 1)
    sns.boxplot(x=housing_df[feature], color='orange')
    plt.title(f'Box Plot of {feature}')
plt.tight_layout()
plt.show()

# Step 4: Identify outliers using the IQR method
print("Outliers Detection:")
outliers_summary = {}
for feature in numerical_features:
    Q1 = housing_df[feature].quantile(0.25)
    Q3 = housing_df[feature].quantile(0.75)
    IQR = Q3 - Q1
    lower_bound = Q1 - 1.5 * IQR
    upper_bound = Q3 + 1.5 * IQR
    outliers = housing_df[(housing_df[feature] < lower_bound) | (housing_df[feature] > upper_bound)]
    outliers_summary[feature] = len(outliers)
    print(f"{feature}: {len(outliers)} outliers")

# Optional: Print a summary of the dataset
print("\nDataset Summary:")
print(housing_df.describe())
OUTPUT:


Outliers Detection:
MedInc: 681 outliers
HouseAge: 0 outliers
AveRooms: 511 outliers
AveBedrms: 1424 outliers
Population: 1196 outliers
AveOccup: 711 outliers
Latitude: 0 outliers
Longitude: 0 outliers
MedHouseVal: 1071 outliers

Dataset Summary:

             MedInc      HouseAge  ...     Longitude   MedHouseVal
count  20640.000000  20640.000000  ...  20640.000000  20640.000000
mean       3.870671     28.639486  ...   -119.569704      2.068558
std        1.899822     12.585558  ...      2.003532      1.153956
min        0.499900      1.000000  ...   -124.350000      0.149990
25%        2.563400     18.000000  ...   -121.800000      1.196000
50%        3.534800     29.000000  ...   -118.490000      1.797000
75%        4.743250     37.000000  ...   -118.010000      2.647250
max       15.000100     52.000000  ...   -114.310000      5.000010

[8 rows x 9 columns]
hello sir, can you share complete dataset.
where u got dataset
details please??
Dataset direct get from online only no need to specify manually…
can you share complete dataset.
Is good
thanks