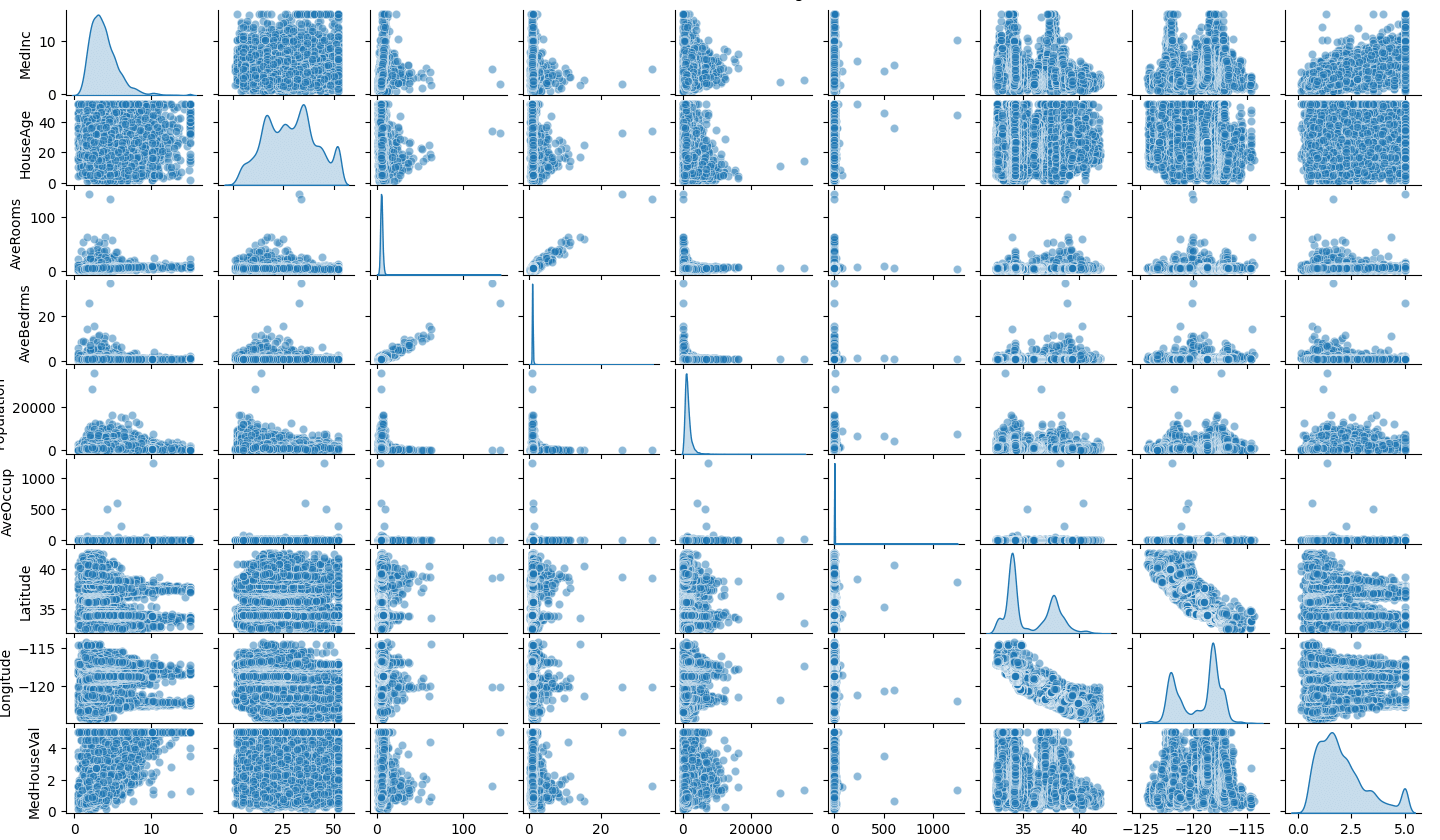
2. Develop a program to Compute the correlation matrix to understand the relationships between pairs of features. Visualize the correlation matrix using a heatmap to know which variables have strong positive/negative correlations. Create a pair plot to visualize pairwise relationships between features. Use California Housing dataset.
PROGRAM:
import pandas as pd
import seaborn as sns
import matplotlib.pyplot as plt
from sklearn.datasets import fetch_california_housing

# Step 1: Load the California Housing Dataset
california_data = fetch_california_housing(as_frame=True)
data = california_data.frame

# Step 2: Compute the correlation matrix
correlation_matrix = data.corr()

# Step 3: Visualize the correlation matrix using a heatmap
plt.figure(figsize=(10, 8))
sns.heatmap(correlation_matrix, annot=True, cmap='coolwarm', fmt='.2f', linewidths=0.5)
plt.title('Correlation Matrix of California Housing Features')
plt.show()

# Step 4: Create a pair plot to visualize pairwise relationships
sns.pairplot(data, diag_kind='kde', plot_kws={'alpha': 0.5})
plt.suptitle('Pair Plot of California Housing Features', y=1.02)
plt.show()
OUTPUT:


can you send all programs in Machine learning to my mail id
couldnt able to download
thankyou
can you send all programs in Machine learning to my mail id
couldnt able to download
thankyou
not making any pdf or lab manual for that….
while executing we are not getting the dataset from the table what you have shown
our table is empty
thanks for help